Daily Leverage Certificates
DLC Hotline: (65) 6226 2828
USDHKD climbs back to 7.85 powered by ‘hawkish’ Fed. UK has the worst growth prospects in the G7 but FTSE100 powers to all time high.
● HK Chief Exec Lee led trade delegation to Middle East to deepen economic and trade cooperation.
● EU imposed new price caps on Russian refined oil products.
● According to China’s Ministry of Industry and Information technology, Chinese Internet industry posts first year-on-year contraction in revenue in 10 years.
● Kuwait Petroleum Corporation says CN oil demand rebounds dramatically.
● Federation of Hong Kong Hotel Owners say occupancy rate did not hike evidently, increase could come later during Labour Day week.
● China Passenger Car Association reports decline of passenger car sales in January 2023.
● CN January PPI slides more than forecast.
● Credit Suisse reports massive loss as clients pull out.
● China trade volume and trade surplus both at all time high according to the State Administration of Foreign Exchange.
● Gold buying by central banks reached the highest in 55 years, China and Turkey among biggest buyers.
● Russia announced it will cut crude oil production by 500,000 barrels per day.
● Russia will eject Euro from National Wealth Fund, to retain Yuan, Gold and Rubles only.
Hang Seng Index closed this week at 21190, down 470 points or 2.17%. Last two month’s rally appears to have run its course. After running into a previous support-turn-resistance zone, market participants took the cue from last week’s reversal candle. This week’s session closed below both 10 and 20 Day SMAs so both indicators will likely flip to act as resistance in the next few weeks. Bulls might or might not make another attempt at overhead resistance but unless the zone between 22200-22665 is broken, bears could take over. The search is probably now on for support. Based on previous swing lows, 20000 could be a potential support. Below 20000 is a less prominent level at around 19450. This was where the market paused during the last three weeks of December 2022. Further below, 100 and 150 Day SMA could act as potential catchment.
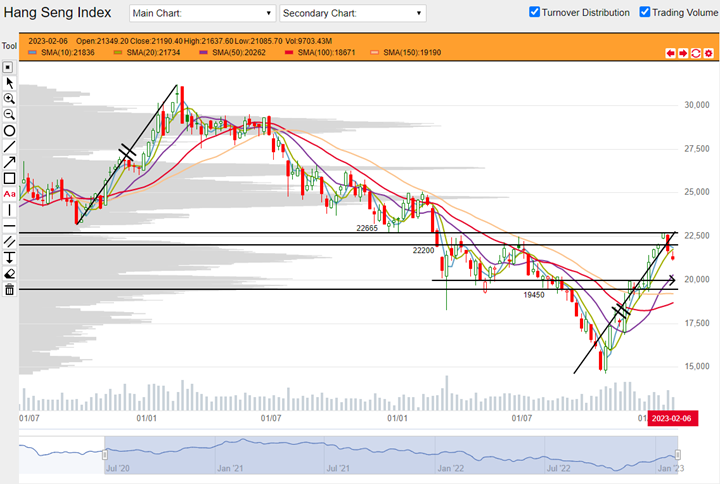
HSI weekly chart from 06 July 2020 to 10 February 2023 (Source: DLC.socgen.com)
Hang Seng Tech closed the week at 4362, down 209 points or 4.58%. Overhead resistance can be observed between 4800-4900. HSTech fell below both 10 and 20 Day SMAs so the short term trend is likely to reverse to bearish. Based on previous price action, 4000 is the most prominent potential support. Slightly above 4000 at around 4100-4150, there was a three week support where the index paused at the end of December. Further below 4000, the 100 Day SMA (red) could also act as potential support.
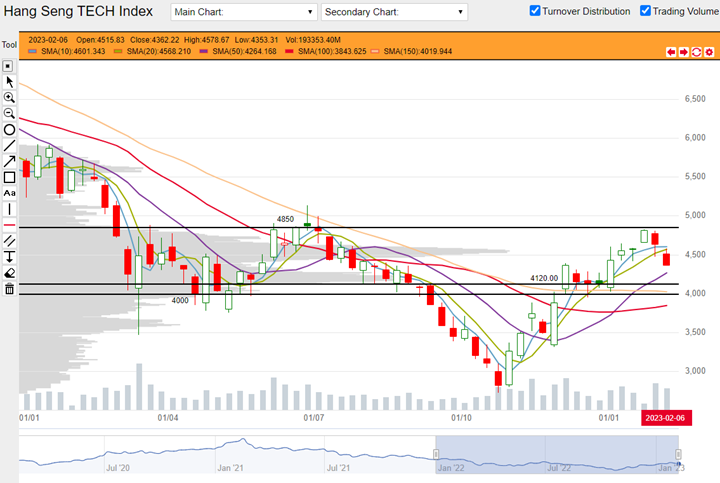
HSTech weekly chart from 03 January 2022 to 10 February 2023 (Source: DLC.socgen.com)
Dow Jones Industrial Average closed the week at 33869, down 57 points or 0.17%. Nasdaq closed the week at 12305, down 268 points or 2.14%. Since the beginning of the year, the Dow has spent five weeks closing at or below Q3 ‘22 high at 34281 (this year's highest traded is 34342). This price action suggests resistance. If the index does not break higher soon, chart watchers will have to suspect that distribution could be taking place and that a change in direction could follow shortly.
The next FOMC meeting is scheduled on 22 March 2023.
Fed funds futures on rate hike probability by next Fed meeting as at last DLC commentary on 03 Feb:
● 99.6% probability of 25 basis points rate hike | 0.04% probability of 50 basis point hike
Fed funds futures on rate hike probability by next Fed meeting at this week’s reading:
● 90.8% probability of 25 basis points rate hike | 9.2% probability of 50 basis points hike
Both Shanghai Composite and Shenzhen Index gapped down from last Friday’s close and then closed their respective gaps during this week’s trading. The Shanghai Index closed at 3260, down only 3 points or 0.08%. Shenzhen Index closed at 11977, down 71 points or 0.549%. Both closed above their 20 Day SMA so they are more bullish than their Hong Kong counterparts. Based on previous swing highs, 3300 has featured as resistance for the Shanghai Composite before so this level is likely to stay until broken convincingly. Intraweek price action also revealed that there is some support from Q4’s high at 3226. Next week look out for the index to test these levels. Below 3226, look for the index’s reaction to 100 and 150 Day SMAs.
Economic data in coming week:
1. Tuesday 14 February 2023 US reports CPI data.
2. Wednesday 15 February 2023 US reports Retail Sales and Empire State Manufacturing Index.
3. Thursday 16 February 2023 US reports PPI data.
Other news:
● AIA bought back shares.
● Baidu and Galaxy Entertainment made new 52-week highs.
● DHL and Baba’s Cainiao agreed to build a self-pickup network in Poland.
● NIO President said the company built the most charging piles in China; 76% of usage of the charging piles were by cars of other makes with BYD in the lead.
● HKEX signed deal with Saudi stock operator Saudi Tadawul Group.
● Baidu to launch ChatGP-style feature in March, JD Cloud will launch ChatJD. Alibaba says its own AI is under development.
● Douyin said to launch nationwide food Delivery on 01 March, followed by correction from close sources; Meituan tumbles.
● According to market chatter, Chinese car and auto parts maker Seres Group is set to debut a SUV with hybrid battery developed by Ganfeng Lithium.
● Berkshire Hathaway again reduced its H-share stake of BYD on 03 February.
● Sunny Optical Jan shipment slid lower.
● Ping An’s holding in ICBC was reduced on 06 February.
Technical observations
CNOOC 883.hk rising trend with higher highs and higher lows
Note chart features:
1. CNOOC was an outperformer in 2022. 2023’s investment theme is likely to be ‘China opening’ so the challenge to investors is whether this opening will power demand for energy that will in turn power CNOOC’s price higher.
2. From the technical point of view, CNOOC is printing a set of higher high and higher low. Moving averages say as much as both price and indicators emerged from a consolidation that ended in the second week of January (see arrow).
3. Prices may or may not consolidate in another round before attempting resistance above $12. Follow price action on 10 and 20 Day SMAs. If there is a correction, inspect $10.32-10.70 for support if any.
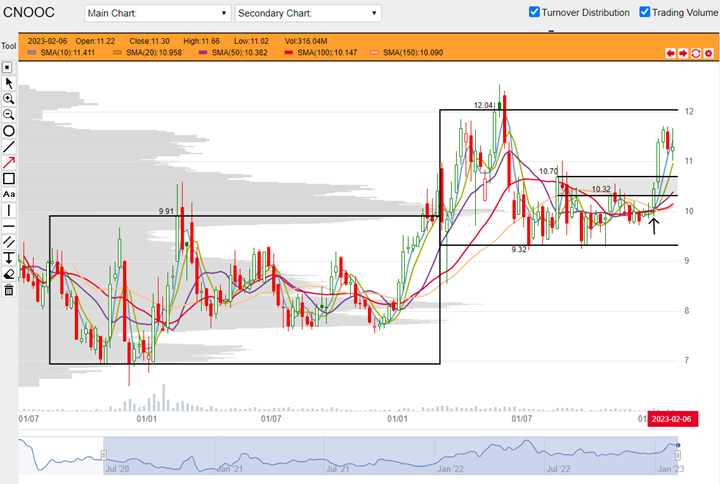
CNOOC 883.hk weekly chart from 26 June 2020 to 10 February 2023 (Source: DLC.socgen.com)
Meituan 3690.hk down on high volume, setup suggests continuation of downtrend from last year.
Note chart features:
1. Based on previous swing high and lows, potential resistance is likely around $193-202. There is also a downward trendline(s) that can be drawn from previous peaks. Meituan ran into these lines and struggled between December last year and January this year. If Meituan’s price action did comply with these trendlines, this would be a setup that is associated with further losses.
2. Meituan fell nearly 7% on high volume this Wednesday 08 February 2023. Reports attributed this sharp move with Douyin (ByteDance) news the evening before, that it would launch a nationwide food delivery service on 01 March. There is some confusion at a point because another report supposedly from a source close to Douyin corrected that its project was a ‘group purchase delivery’ and there is no concrete timeframe for launch.
3. Meituan has fallen below its entire complex of moving averages. This is another setup that is associated with downtrend although this kind of signal can also appear if Meituan was range bound. Based on previous swing lows, potential support could come in between $122-135

Meituan 3690.hk weekly chart from 01 March 2021 to 10 February 2023 (Source: DLC.socgen.com)
Underlying Index/Stock |
Underlying Chg (%)1 |
Long DLC (Bid Change%2) |
Short DLC (Bid Change%2) |
|---|---|---|---|
| Hang Seng Index (HSI) | -1.87% | RQGW (-11.31%) | WIEW (+11.72%) |
| Hang Seng TECH Index (HSTECH) | -3.26% | ECJW (-8.53%) | Y9GW (+11.30%) |
| CNOOC (0883.HK) | -0.46% | EOOW (+2.74%) | |
| Meituan (3690.HK) | -4.91% | UOLW (-22.53%) | 96KW (+26.61%) |
Brought to you by SG DLC Team
This advertisement has not been reviewed by the Monetary Authority of Singapore. This advertisement is distributed by Société Générale, Singapore Branch. This advertisement does not form part of any offer or invitation to buy or sell any daily leverage certificates (the “DLCs”), and nothing herein should be considered as financial advice or recommendation. The price may rise and fall in value rapidly and holders may lose all of their investment. Any past performance is not indicative of future performance. Investments in DLCs carry significant risks, please see dlc.socgen.com for further information and relevant risks. The DLCs are for specified investment products (SIP) qualified investors only.
Full Disclaimer - here